Measuring
This page is hw/femu/docs/guides/measuring.md at FEMU 39a55eeb6 (2026-10-02), licensed GPL-2.0-or-later. Send corrections to the FEMU repository.
How to read FEMU's counters, measure latency and throughput from the guest,
and get numbers that repeat from run to run. Commands in sh blocks run
inside the guest unless they say otherwise. From the host, prefix a single
command with ./run-guest-ssh.sh as in the
quick start; run multi-line blocks in a
shell inside the guest (./run-guest-ssh.sh with no arguments).
Before you measure anything, tune the host as in performance tuning. Most surprising numbers come from a FEMU thread that did not get a core.
What FEMU can tell you
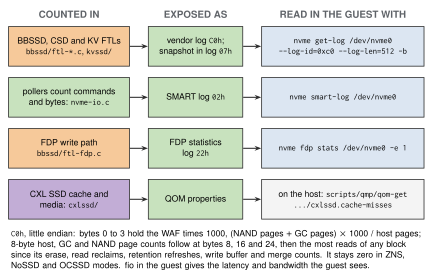
Figure: Where FEMU's counters come from and how you read them: FTL media counters in vendor log C0h, command and byte counts in the SMART log, FDP statistics, and CXL SSD counters as QOM properties on the host.
| Source | Read with | Modes | What it holds |
|---|---|---|---|
| Vendor log page C0h | nvme get-log --log-id=0xc0 | BlackBox (with or without FDP), CSD, KV | WAF, host, GC and NAND page counts, write buffer hits, read reclaim, log-block merges |
| SMART log | nvme smart-log | every NVMe mode | data read and written, command counts, Percentage Used, Available Spare, media errors |
| FDP statistics | nvme fdp stats | BlackBox with FDP | host and media bytes written |
| QOM counters | QMP qom-get on the host | femu-cxl-ssd | cache hits and misses, media reads, programs and time, direct mapping |
| fio | in the guest | every block mode | latency and throughput as the guest sees them |
ZNS, NoSSD and OCSSD leave the C0h counters at zero. ZNS has no device garbage collection: the host resets zones.
The guest's own tools show I/O from the guest's side: iostat -x 1 per
device, iotop per process, dstat -cdn for CPU, disk and network
together.
Write amplification and media counters (C0h)
The first 4 bytes of log page C0h are the write amplification factor (WAF) times 1000. The three 8-byte counters from byte 8 are pages the host wrote, pages garbage collection moved, and pages programmed for the host:
sudo nvme get-log /dev/nvme0 --log-id=0xc0 --log-len=512 -b | od -An -t u4 -N 4
sudo nvme get-log /dev/nvme0 --log-id=0xc0 --log-len=512 -b | od -An -t u8 -j 8 -N 24 -w24
FEMU computes the WAF as
(pages programmed + pages GC moved) x 1000 / pages the host wrote. The
counters are summed over every BlackBox, CSD and KV namespace of the
controller, and they count from the moment QEMU started the device (or
from when namespace management created the namespace). The WAF
in the log is therefore the WAF since start, not the WAF of your last run.
To measure one run, read the counters before and after it and use the
differences:
c0() {
    sudo nvme get-log /dev/nvme0 --log-id=0xc0 --log-len=512 -b |
        od -An -t u8 -j 8 -N 24 -w24
}
c0 > before.txt
sudo fio --name=run --filename=/dev/nvme0n1 --direct=1 --ioengine=libaio \
    --rw=randwrite --bs=4k --iodepth=32 --size=4G
c0 > after.txt
paste before.txt after.txt | awk '{ h = $4 - $1; g = $5 - $2; n = $6 - $3;
    printf "host %d  gc %d  nand %d  WAF %.3f\n", h, g, n, (n + g) / h }'
Pages the write buffer absorbs (buffer_size) count as host pages but not
as programmed pages until they leave the buffer, so with a buffer the WAF
of a short run can be below 1. The other fields (read reclaim, write
buffer hits, log-block merges) are listed in
log pages and counters.
GC starts when gc_thres_pcent (75% by default) of the lines are in use. A
WAF of 1.000 after a run means GC has not run yet, or found no valid pages
to move. To make GC run, write more than the free space, as in
the BlackBox guide.
SMART and FDP statistics
sudo nvme smart-log /dev/nvme0
FEMU fills these SMART fields:
data_units_read,data_units_written: thousands of 512-byte units the host moved, rounded up.host_read_commands,host_write_commands.percentage_used: wear of the most worn namespace, from erase counts andpe_cycles_rated(or the rating ofnand_cell_type); 0 when neither is set.available_spare: the worst namespace, fromnand_bad_blocks.media_errors,num_err_log_entries,temperature(thetemperatureproperty), power-on hours and unsafe shutdowns.
With FDP, the endurance group statistics give host and media bytes written. Their ratio is the WAF over the endurance group, every FDP namespace of the subsystem:
sudo nvme fdp stats /dev/nvme0 -e 1
CXL SSD counters
The femu-cxl-ssd counters are QOM properties, read on the host through
QMP. Add a QMP socket to the run-cxlssd.sh command line
(-qmp unix:/tmp/qmp.sock,server=on,wait=off), then on the host, from the
QEMU source tree:
export QMP_SOCKET=/tmp/qmp.sock
scripts/qmp/qom-get /machine/peripheral/cxlssd.cache-misses
scripts/qmp/qom-get /machine/peripheral/cxlssd.media-time-ns
scripts/qmp/qom-get /machine/peripheral/cxlssd.media-full
cxlssd is the id= that run-cxlssd.sh gives the device.
stats-resetclears the cache, prefetch and caching API (cca-*) event counters. It copies the cache and prefetch counters to thelast-*properties first. It does not clear the media counters (media-reads,media-writes,media-time-ns) or theder-*counters, so measure those as differences between two reads.media-fullmust stay 0. A non-zero value means some NAND programs found no free page and were not timed, and the run is not valid.- Accesses served through a direct mapping (
der=memslotorcylon) never reach QEMU and are not counted as hits.
The full list is in runtime properties.
Latency and throughput with fio
Use --direct=1 so the guest page cache does not answer for the device.
Report the completion latency (clat) percentiles, not only the mean.
NoSSD
NoSSD has no media time, so it measures FEMU's own path. Unwritten blocks read as fast as written ones.
sudo fio --name=lat --filename=/dev/nvme0n1 --direct=1 --ioengine=io_uring \
    --rw=randread --bs=4k --iodepth=1 --runtime=30 --time_based
sudo fio --name=tput --filename=/dev/nvme0n1 --direct=1 --ioengine=io_uring \
    --rw=randread --bs=4k --iodepth=64 --numjobs=4 --group_reporting \
    --runtime=30 --time_based
For throughput beyond one poller, see pollers and queues.
BlackBox and CSD
A read of a page that was never written costs no NAND time. Fill the range first, then read it:
sudo fio --name=fill --filename=/dev/nvme0n1 --direct=1 --ioengine=libaio \
    --rw=write --bs=128k --iodepth=16 --size=4G
sudo fio --name=rr --filename=/dev/nvme0n1 --direct=1 --ioengine=libaio \
    --rw=randread --bs=4k --iodepth=1 --size=4G --runtime=30 --time_based
On an idle device at queue depth 1, a 4 KiB read takes about pg_rd_lat
(40 us by default) plus the guest's and the poller's overhead, and a 4 KiB
write about pg_wr_lat (200 us) when there is no write buffer. Measure the
overhead on a NoSSD device with the same guest and subtract it.
To see GC in the latency, age the device first: random writes over the
whole namespace, several times, until the C0h WAF stops rising. Then
measure. The tail percentiles (clat 99th and above) show GC; the median
mostly does not.
ZNS
Write sequentially inside zones, and reset the zones between runs:
sudo fio --name=zns --filename=/dev/nvme0n1 --direct=1 --ioengine=psync \
    --zonemode=zbd --rw=write --bs=128k --size=1G
sudo fio --name=zr --filename=/dev/nvme0n1 --direct=1 --ioengine=psync \
    --zonemode=zbd --rw=randread --bs=4k --size=1G --runtime=30 --time_based
sudo blkzone reset /dev/nvme0n1
A write costs 1 us per 4 KiB page while it fits in the zone's write cache; the write that fills the cache pays for programming it (timing model).
FDP
fio places data with its io_uring_cmd engine on the generic node. Run the
same job with and without --fdp=1 and compare the WAF:
sudo fio --name=fdp --filename=/dev/ng0n1 --ioengine=io_uring_cmd --cmd_type=nvme \
    --fdp=1 --fdp_pli=0,1,2,3 --rw=randwrite --bs=4k --iodepth=16 --size=4G
KV, OCSSD and CXL
- KV has no block device, and fio has no key-value engine. Time the
passthrough commands in your own program;
kv-probe.cis a starting point (KV guide). - OCSSD needs a guest kernel older than 5.15 with pblk, or SPDK (OCSSD guide).
- For the CXL SSD, run your workload on the DAX device or NUMA node of the region (CXL SSD guide), and read the QOM counters above before and after.
Repeatable numbers
-
Fix the host. Pin vCPUs, pollers and the FTL thread to their own cores, set the CPU frequency policy to performance, and keep other work off those cores (performance tuning).
-
Record the setup. The FEMU commit, the
-deviceline (run-blackbox.sh,run-blackbox-fdp.shandrun-csd.shprint it;DRY_RUN=1 ../femu-scripts/run-cxlssd.shprints the CXL command), the guest kernel and the fio job file. A number without these cannot be compared. -
Start from a known state. Restart QEMU between configurations. The device memory and every counter start from zero when QEMU starts; a guest reboot or controller reset keeps both. A namespace created with namespace management starts its counters at zero, and deleting one removes its counts from C0h. Then precondition: fill the range you will read, and for steady-state write numbers, overwrite at random until the WAF stops changing.
-
Measure intervals, not totals. Read C0h, SMART or the QOM counters before and after each run and use the differences.
-
Run long enough, more than once. Use
--time_basedwith a--ramp_time, run each point at least three times, and report the median and the spread. -
Check FEMU kept up. On a BlackBox controller, vendor command 0xEF with CDW10 5 prints to QEMU's console how many completions were posted 20 us or more after they were due, out of all completions, and resets both counts.
run-blackbox.shcopies the console tobuild-femu/log. Its standard output goes through a pipe there, so the line can appear only later; putstdbuf -oLin front of./qemu-system-x86_64on the launcher'ssudoline to see it at once. Reset the counts before a run, read them after:sudo nvme admin-passthru /dev/nvme0 --opcode=0xef --cdw10=5The line ends with the two counts as
A/B. If A is more than a small share of B, the pollers did not get enough CPU and the latencies are longer than the model. -
Keep the timing switches in mind. 0xEF codes 2 and 4 turn GC time and NAND time off until you turn them back on with 1 and 3, and code 3 restores the built-in times, not the ones on your command line (timing model). Restart QEMU after using them.
Related pages
Related issues: #7, #15, #92, #130, #137, #151.